The CenSoc team at UC Berkeley is excited to announce the release the Berkeley Unified Numident Mortality Dataset (BUNMD). The BUNMD is a microlevel dataset providing researchers access to over 49 million US mortality records, including nearly complete coverage of deaths to individuals 65+ from 1988-2005. The demographic covariates and fine geographic detail allow for high-resolution mortality research.
The BUNMD is a very large, stand-alone data set. It is being released along with two other datasets that can be linked with rich-covariates in the 1940 Census. (For details and downloads, go to http://censoc.berkeley.edu)
BUNMD Dataset
The National Archives’ 2019 release of the Social Security Numident Records created a new administrative data resource for researchers studying mortality. We purchased copies of this public data and are now releasing a publicly available data set. The data, originally in dozens of files of different types, has been cleaned and unified into a single file with one record per person, allowing researchers to jump right in and begin analysis. Details of how the data was processed are available in BUNMD working paper by Joshua R. Goldstein and Casey Breen.
The BUNMD includes several demographic covariates:
- Sex
- Race
- Place of Birth
- ZIP Code of residence at time of death
- State where Social Security Card was issued
- Individual identifiers are also available
For a complete list of variables, please see the BUNMD codebook.
Mortality Estimation
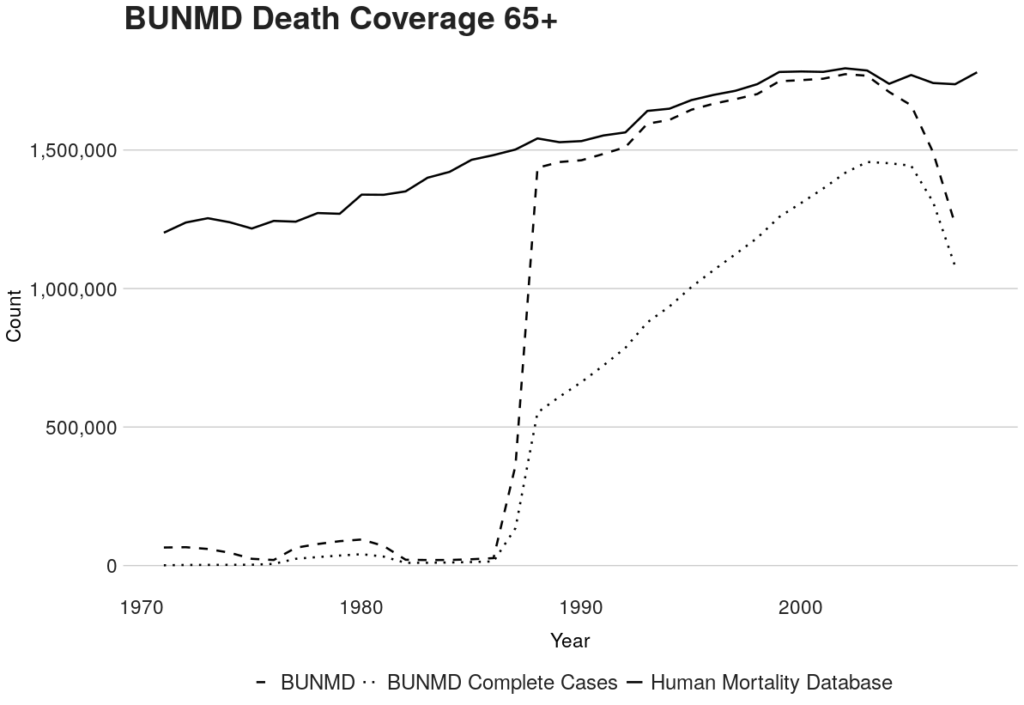
The BUNMD has nearly complete death coverage of individuals 65+ dying between 1988-2005. Weights are provided to match the counts of death to those estimated for these ages and years by the Human Mortality Database.
Research possibilities
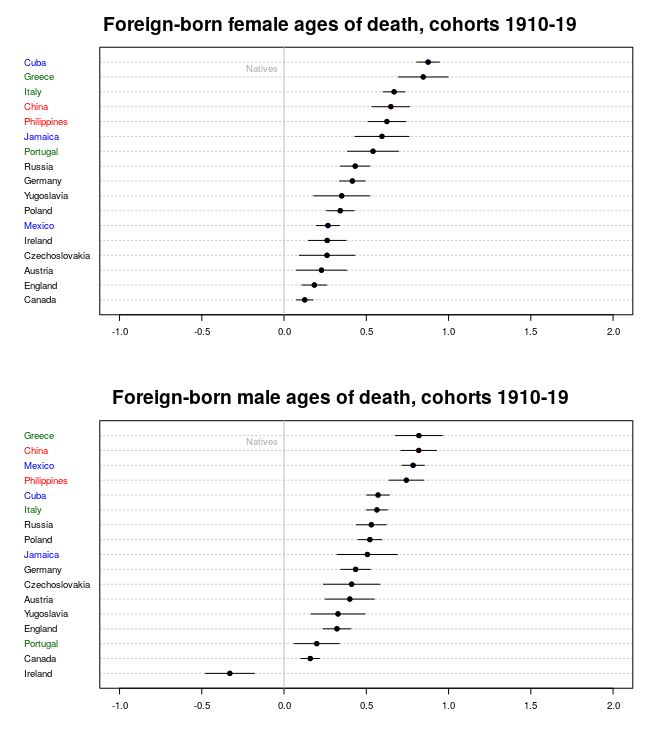
The BUNMD can be used to explore country-of-birth mortality differentials. Large sample sizes lend enough precision to see interesting patterns by individual county. For example, we can confirm there is an immigrant mortality advantage—with the exception of Irish men—as shown in the figure below.
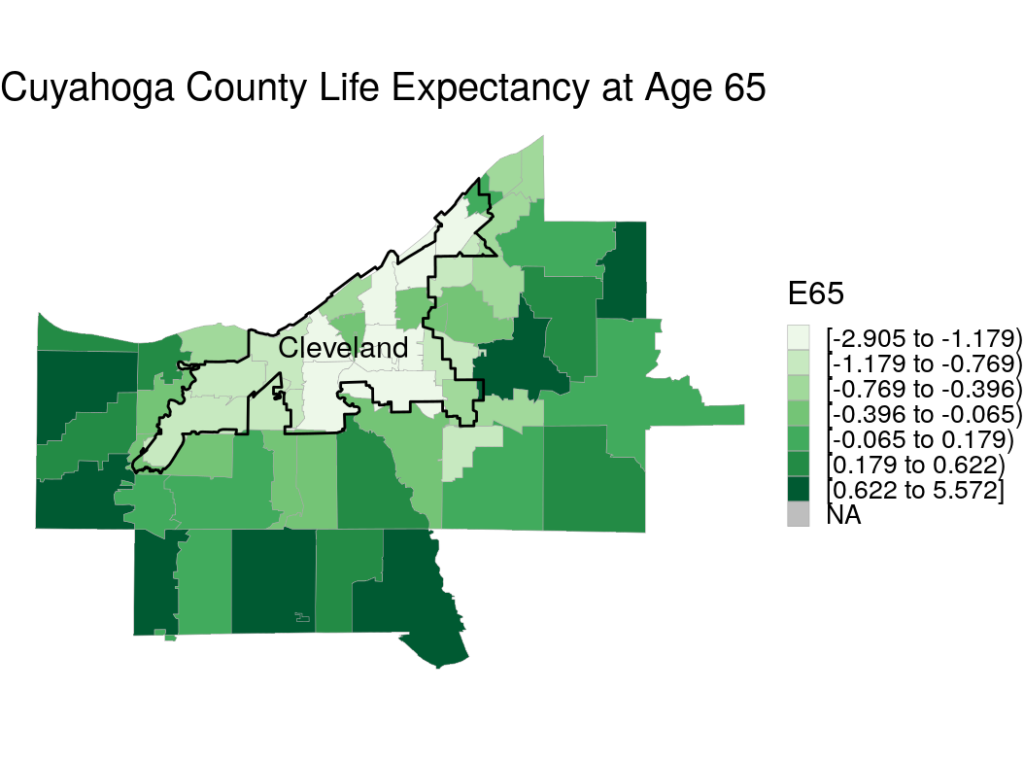
Researchers can also take advantage of the ZIP Code geographic resolution of the BUNMD. The choropleth map below shows e(65)—life expectancy conditional on living to age 65—for Cleveland’s Cuyahoga county. These old-age mortality disparities are likely driven by racial segregation.
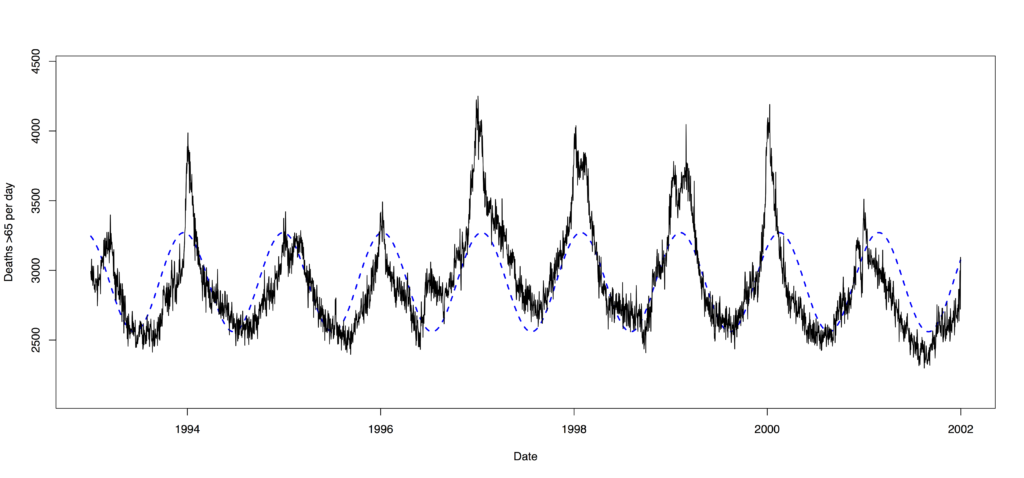
The BUNMD’s individual death counts by day allow researchers to study who was hit
hardest by the flu, by ZIP Code, race, exact date of birth, and more. The figure below shows the
four US big flu seasons at the end of the 1990’s.
For more information, please see the BUNMD working paper. Replication materials are available on GitHub.